
Below is a plain-text transcript of all 34 slides in the 2026 Metorik Insights for WooCommerce report. A PDF version is also available.
1. Cover
Metorik Insights for WooCommerce, 2026 Edition. Version 1.1, updated 8 April 2026.
2. Contents
Introduction, General Stats, Orders, Customers, Globalization, and Metorik case studies.
3. Introduction
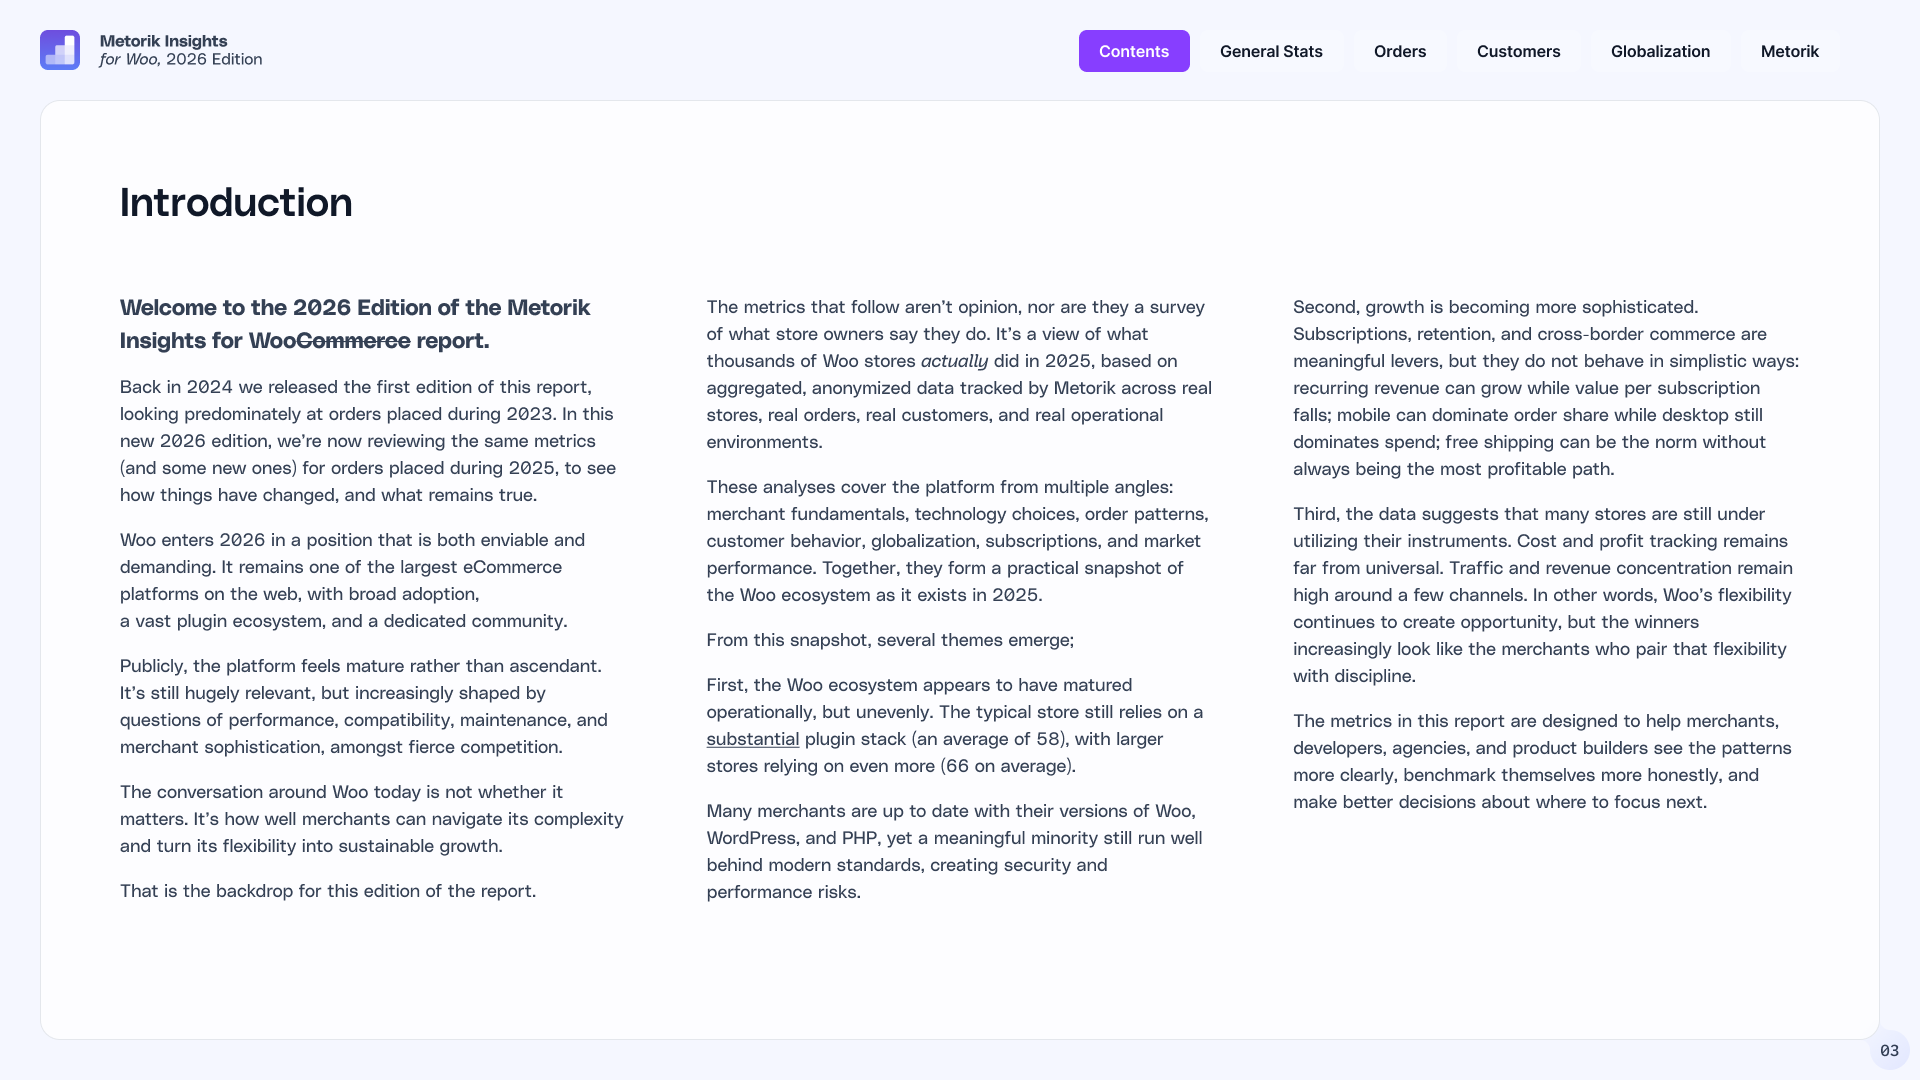
Welcome to the 2026 edition of the Metorik Insights for WooCommerce report. In 2024 we released the first edition, looking predominantly at orders placed during 2023. In this new 2026 edition, we review the same metrics (and some new ones) for orders placed during 2025, to see how things have changed and what remains true.
WooCommerce enters 2026 in a position that is both enviable and demanding, still one of the largest eCommerce platforms on the web, with broad adoption, a vast plugin ecosystem, and a dedicated community, but increasingly shaped by questions of performance, compatibility, maintenance, and merchant sophistication amidst fierce competition.
The metrics that follow aren't opinion, nor are they a survey of what store owners say they do. It's a view of what thousands of Woo stores actually did in 2025, based on aggregated, anonymized data tracked by Metorik across real stores, real orders, real customers, and real operational environments.
Several themes emerge. First, the Woo ecosystem has matured operationally, but unevenly, the typical store still relies on a substantial plugin stack (an average of 58, with larger stores relying on 66). Many merchants are up to date with their versions of Woo, WordPress, and PHP, yet a meaningful minority still run well behind modern standards, creating security and performance risks.
Second, growth is becoming more sophisticated. Subscriptions, retention, and cross-border commerce are meaningful levers, but they do not behave in simplistic ways: recurring revenue can grow while value per subscription falls; mobile can dominate order share while desktop still dominates spend; free shipping can be the norm without always being the most profitable path.
Third, the data suggests that many stores are still under-utilizing their instruments. Cost and profit tracking remains far from universal. Traffic and revenue concentration remain high around a few channels. Woo's flexibility continues to create opportunity, but the winners increasingly look like the merchants who pair that flexibility with discipline.
4. The data
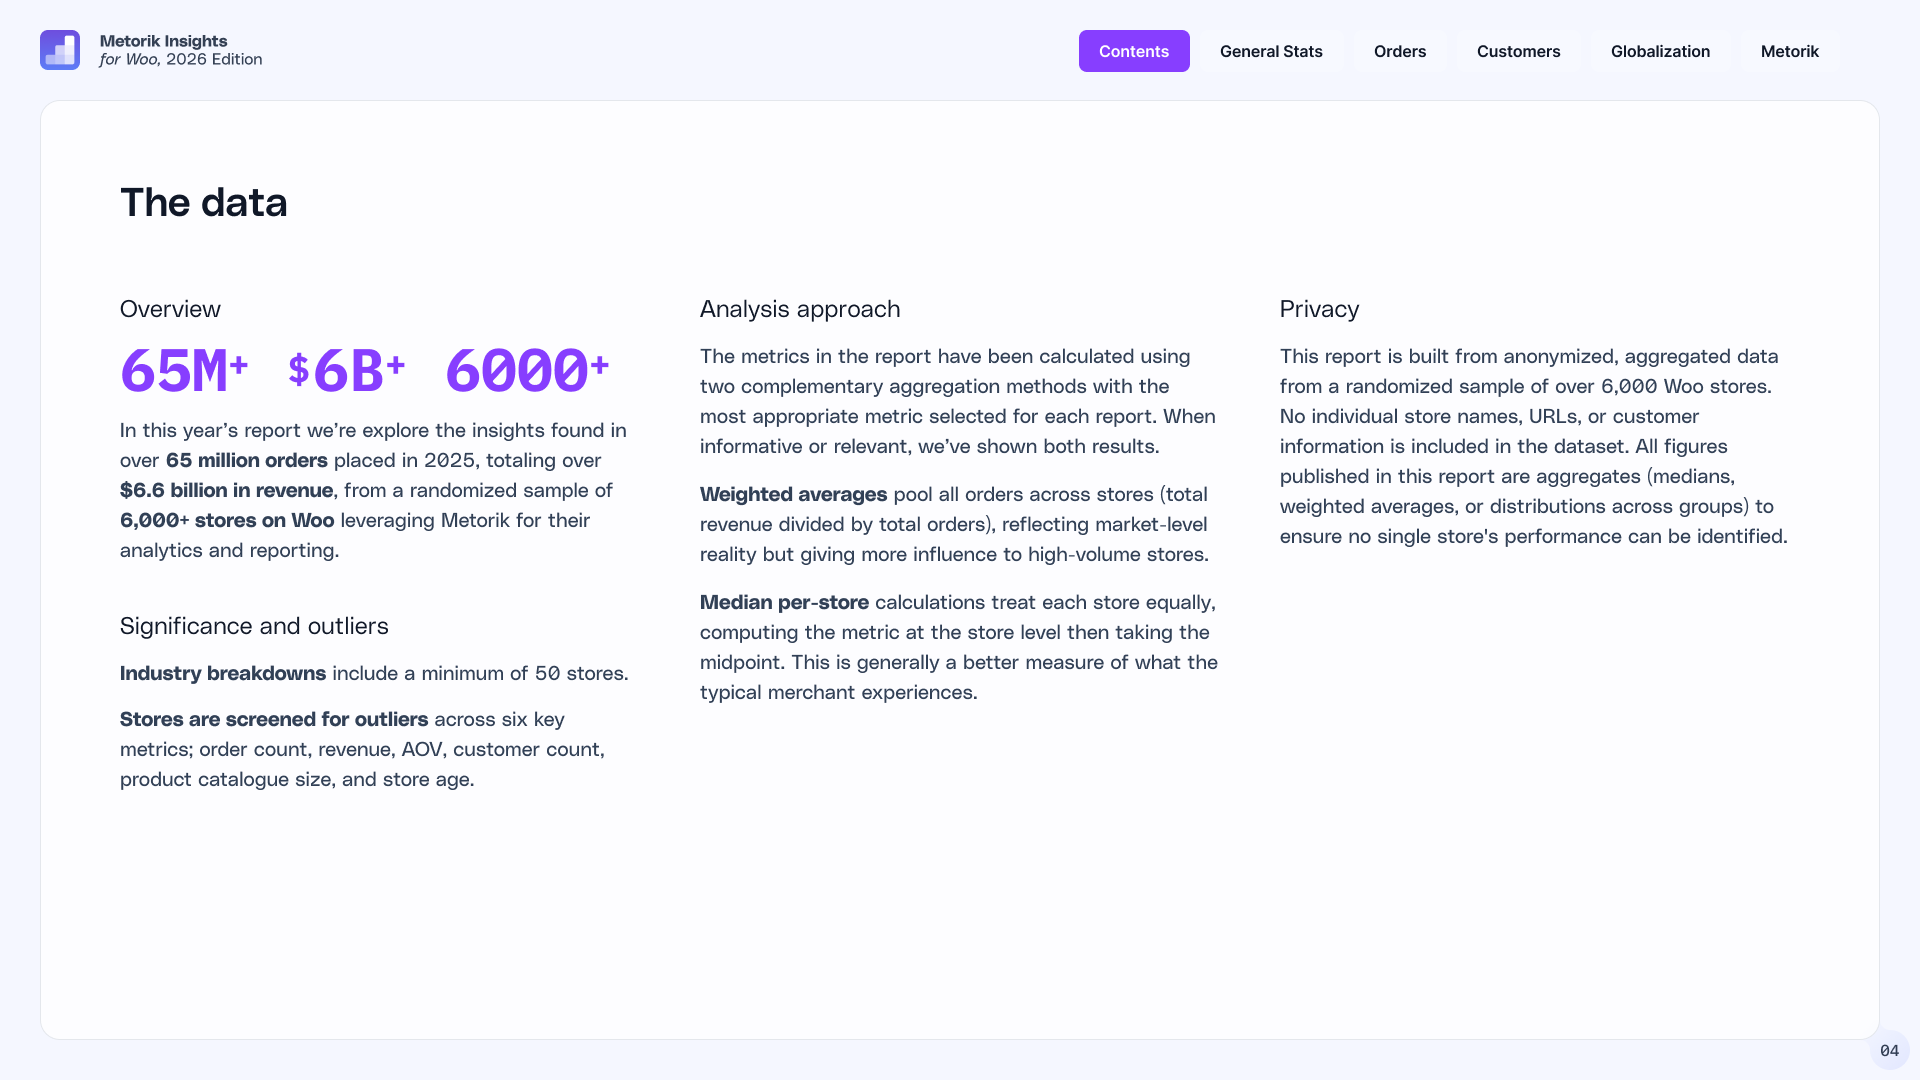
This report explores the insights found in over 65 million orders placed in 2025, totaling over $6.6 billion in revenue, from a randomized sample of 6,000+ stores on WooCommerce leveraging Metorik for their analytics and reporting. No individual store names, URLs, or customer information is included in the dataset, all figures are aggregates (medians, weighted averages, or distributions across groups).
Metrics are calculated using two complementary aggregation methods: weighted averages pool all orders across stores (total revenue divided by total orders), reflecting market-level reality but giving more influence to high-volume stores. Median per-store treats each store equally, computing the metric at the store level then taking the midpoint, a better measure of what the typical merchant experiences. Industry breakdowns include a minimum of 50 stores. Stores are screened for outliers across six key metrics: order count, revenue, AOV, customer count, product catalogue size, and store age.
5. Store sizes and yearly comparisons
Stores are segmented into four revenue tiers based on 2025 revenue:
- Starter, less than $50k revenue in 2025
- Small, $50k to $250k revenue in 2025
- Medium, $250k to $1M revenue in 2025
- Large, over $1M revenue in 2025
Yearly comparisons are shown across most metrics to reveal the directionality of trends for orders placed in 2023, 2024, and 2025. For percentage metrics, change is shown as a relative percentage, a metric that was 10% in 2024 and 15% in 2025 is displayed as 50% growth. Where growth hasn't been statistically significant, we've shown "Steady".
6. General Stats
Before diving into orders, customers, and global trends, we profile the infrastructure powering these stores: how old the typical Woo store is, what software it runs, how many plugins it relies on, and which themes and tools dominate the ecosystem.
7. Overview
25% of stores across all industries leverage subscription orders (down 1.2% vs 2024, down 10% vs 2023). 39% of stores are tracking their costs and profit alongside their sales using Metorik, this isn't to say the remainder aren't tracking costs, just that they're not tracking them in Metorik (down 2.5% vs 2024, up 21% vs 2023). The average WooCommerce store is about 5 years old (4 years, 11 months, 15 days). 20% of stores sell in multiple currencies (down 1.4% vs 2024, up 12% vs 2023).
8. WordPress, WooCommerce, and PHP versions
Version data collected and analyzed 1 March 2026 (not end of 2025).
- WooCommerce: 42% on the latest Woo version (10.5); 83% on the 10.x line overall. Only 10% on the 9.x line, and 4.9% on < 9.0. Within 10.x: 10.5 is 42%, 10.4 is 26%, 10.3 is 8.1%, 10.2 is 3.3%, 10.1 is 2.7%, 10.0 is 1.3%.
- WordPress: 71% on the latest WordPress version (6.9). 19% on 6.8, 4.0% on 6.7.
- PHP: PHP 8.2 is the most common version at 33%, followed by 8.3 at 24%, 8.1 at 18%, 8.4 at 9.5%, 8.0 at 3.2%, and 8.5 at 0.7%. About 12% of stores are still on PHP 7.4, a meaningful security and performance concern.
9. Themes
44% of stores use a child theme (Steady vs 2024 and 2023). 56% of Woo stores are not using child themes, meaning the majority are either customizing parent themes directly (risking update breakage) or using themes/builders that don't require child themes.
Top 10 themes by percent of stores:
- Elementor: 9.3%
- Flatsome: 7.4%
- Woodmart: 4.5%
- Astra: 4.5%
- Shoptimizer: 2.8%
- Divi: 2.3%
- Salient: 2.0%
- Bricks: under 1%
- GeneratePress: under 1%
- Kadence: under 1%
Canada leads all major markets at 52% child-theme usage, nearly 18 points above the global average, followed by the Netherlands at 50%. Woo's original default theme, Storefront, has fallen to just 0.8% share, a remarkable decline for the platform's own theme.
10. Plugin counts
The average store runs 58 active plugins, remarkably stable since 2023. The highest number of active plugins on a single store is 237. Distribution: 17% of stores run 41–50 plugins, 18% 51–60, 15% 31–40, 13% 21–30, 8.6% 61–70.
Store size correlates with plugin count: Starter stores average 51, Small 54, Medium 60, Large 66. Food & Beverage is the most plugin-heavy industry at 66 average, likely reflecting compliance, logistics, and regulatory demands.
11. Top Woo and WordPress plugins
Top 20 Woo-specific plugins:
- Stripe Gateway: 40%
- Legacy REST API: 30%
- Facebook for WooCommerce: 29%
- PDF Invoices & Packing Slips: 28%
- WooCommerce Subscriptions: 27%
- PayPal Payments: 25%
- Shipment Tracking: 18%
- Advanced Order Export: 18%
- Mailchimp for Woo: 17%
- Product Bundles: 17%
- Smart Coupons: 16%
- Google for WooCommerce: 15%
- Google Analytics for Woo: 14%
- Variation Swatches: 14%
- Discount Rules: 14%
- ShipStation: 12%
- WP All Import (Woo): 12%
- WooPayments: 11%
- Checkout Field Editor: 11%
- Yoast SEO: Woo: 11%
Top 20 general WordPress plugins on Woo stores:
- Yoast SEO: 49%
- Elementor: 40%
- Advanced Custom Fields: 36%
- WP Mail SMTP: 35%
- Redirection: 32%
- Wordfence Security: 31%
- Classic Editor: 30%
- WP Rocket: 29%
- GTM4WP: 27%
- Code Snippets: 27%
- Contact Form 7: 26%
- Klaviyo: 26%
- Loco Translate: 24%
- Akismet Anti-Spam: 24%
- WP Crontrol: 23%
- User Switching: 23%
- Gravity Forms: 23%
- Query Monitor: 22%
- Rank Math SEO: 21%
- Jetpack: 21%
CBD stores are the only industry where the Stripe Gateway doesn't appear in the top 20, Authorize.Net (22%) fills the gap as a payment gateway willing to serve high-risk merchants. PDF Invoices & Packing Slips hits 64.6% in the Netherlands and 61% in France, driven by EU invoicing and VAT compliance. Wordfence is used by 41% of Health & Wellness stores, the highest adoption of any industry.
12. Orders
We examine how quickly stores reach key milestones, what shoppers spend and when, how discounting and refund behavior varies by industry, and which custom statuses merchants are building into their workflows.
13. Order milestones
Key order-count milestones, from the first 100 orders to 1 million orders, percentage of stores that reach each milestone, and median days to get there (median used to avoid fast-growing outliers skewing the mean):
- 100 orders, 90% of stores reach it, median 68 days
- 1,000 orders, 75% of stores, median 259 days
- 10,000 orders, 42% of stores, median 758 days
- 100,000 orders, 10% of stores, median 1,446 days
- 1,000,000 orders, under 1% of stores, median 1,953 days
CBD and Vitamins/Supplements stores scale faster and further than almost any other vertical, CBD has the highest rate of reaching 10K orders (56%) and 100K orders (16%). Cosmetics & Skincare have the highest 1M-order rate (3x more likely than average) and the highest 100-order attainment rate (93%). Clothing & Footwear hit early milestones fast (100 orders in 58 median days, 1,000 in 253) but plateau hard, only 35% ever reach 10K orders.
14. Average Order Value by day of week
Across 65M+ orders, AOV is much lower on weekends than weekdays. The daily average (all stores) is $105. Weekend discount: customers typically spend ~$30 less than the weekday average.
- Monday: $116 AOV, 15% of orders
- Tuesday: $116 AOV, 15% of orders
- Wednesday: $109 AOV, 15% of orders
- Thursday: $112 AOV, 14% of orders
- Friday: $106 AOV, 15% of orders
- Saturday: $86 AOV, 12% of orders
- Sunday: $86 AOV, 14% of orders
Australian stores see the most extreme weekend drop (~31%, from $190 to $119), nearly double the global average. Large stores experience a larger weekend AOV collapse (~19% drop) than Starter (~8%), Small (~13%), or Medium (~12%). Fashion is the only industry where Friday is the highest-AOV day ($122).
15. Orders by hour and day
Peak AOV occurs on Tuesday at 11am. Peak order volume occurs on Sunday at 8pm. Order times use the store's timezone setting.
16. Discounting by industry
Discount rate (percentage of orders that include a discount) and discount amount (average discount as a percentage of original order value) vary sharply by industry. Overall averages: 25% of orders discounted (up 2.1% vs 2024, down 7.8% vs 2023); average discount amount 22% of order value (up 0.9% vs 2024, down 3.5% vs 2023).
Cannabis leads discounting at 45% of orders discounted, suggesting fierce competition, high influencer-code usage, and affiliate-driven acquisition. Larger stores discount more often but give smaller discounts (a sign of strategic sophistication). Canada discounts 4.5x more often (36%) than Sweden (8%), though Canada's discount amount is the lowest among major countries at just 15% of order value.
17. Refunds by industry
Refund rate (percentage of orders partially or fully refunded) and refund amount (average refund as a percentage of original order value). Average refund rate is 1.4%, down significantly from 2.4% in 2023 and 1.6% in 2024. This may suggest stores are improving product listings, sizing info, and setting expectations, or that return policies are tightening.
Clothing is the refund-rate outlier at 6.5%, more than 4x the overall average; for apparel merchants, refunds aren't a bug but a structural cost of the business model. Larger stores have lower refund rates but dramatically higher refund amounts: Large-tier stores have a 1.4% refund rate with a $252 average refund, while Small-tier stores show a 1.7% rate but only $122 per refund.
18. Custom order statuses
51% of stores are using custom order statuses (up 24% vs 2023). Most common, consolidated:
- Shipped / In Transit
- Delivered
- Partial Payment
- Ready for Pickup
- Spam Order
- Out for Delivery
- Partially Shipped
- Pre-Ordered
- Return Lifecycle (requested / approved / cancelled / returned)
- Awaiting Payment
- Authorized
- Awaiting Shipment
19. Customers
Acquiring a customer is expensive. Keeping one is where the real leverage lives. This section looks at the value of returning customers, how the mobile-desktop balance continues to shift, and what cart abandonment really looks like across industries.
20. AOV change for returning customers
Comparing new vs returning customer AOV using a weighted average and a per-store median. For the typical store, returning customers are more valuable, though weighted averages can suggest otherwise, don't let aggregate stats mislead you about your own retention economics.
- Median per-store: AOV for new customer orders is $99; returning customer orders $108.
- Weighted average: new $117, returning $94, the opposite direction.
Per-store median AOV uplift for returning customers, by industry:
- Animal & Pet Supplies: +42% ($68 new → $97 returning)
- Vitamins & Supplements: +24%
- Cannabis: +22%
- Cosmetic, Haircare & Skincare: +22% (with a +40% peak in the medium-tier)
- Alcohol: +21%
- Food & Beverage: +21%
- Health & Wellness: +18%
- Clothing, Footwear & Accessories: +13%
- Home Goods & Furniture: +9.4%
- Arts, Crafts & Design: +7.2%
- Education: −8%
- Fitness: −12%
- Software: −13%
- Consumer Electronics & Appliances: −15%
- Online Learning: −29% (notable exception: stores here should consider premium tiers rather than relying on natural repeat expansion)
The Netherlands shows the highest returning-customer premium of any major country (+50% weighted, +20% median). European markets appear to have stronger repeat-purchase dynamics.
21. Devices
Mobile has officially taken over WooCommerce, nearly 72% of orders now happen on mobile, up almost 10 percentage points in just two years. But desktop isn't dead: desktop shoppers still spend 2.3x more per order on average.
- Desktop: 28% of orders at $167 AOV. AOV is up 3.6% vs 2024 and 10.4% vs 2023; desktop's share of orders is down 4.1% vs 2024 and down 26% vs 2023.
- Mobile & Tablet: 72% of orders at $71 AOV. AOV is up 9.6% vs 2024 but down 17% vs 2023; mobile's share of orders is up 1.7% vs 2024 and 16% vs 2023.
Mobile's year-over-year gain is decelerating (1.2pp from 2024–25 vs ~8.7pp from 2023–24), suggesting we may be approaching a plateau. The US is the most desktop-resilient major market with 44% desktop share (US desktop AOV $190 vs mobile $139, a much smaller relative gap of 1.37x). Fitness has the highest mobile share (79%) but also the largest device-AOV gap (2.43x), high-value equipment and bundles are researched and bought on larger screens.
22. Cart placement and abandonment
Using Metorik's cart tracking and recovery emails, we see the value and behavior of carts placed, abandoned, and recovered in 2025. Across the All Store Average, 21% of placed carts are abandoned and 3.6% are recovered via Metorik Engage. Clothing has the highest abandonment rate at 34%; Other the lowest at 7%. Averages:
- Avg placed cart value: $117 (down 3.7% vs 2024, down 1.3% vs 2023)
- Avg abandoned cart value: $141 (down 18% vs 2024, down 10% vs 2023)
- Avg recovered cart value (via Metorik Engage): $174 (up 12% vs 2024, up 12% vs 2023)
23. Subscription lifecycle
Weekends are a subscription "safe zone", cancellation rates drop far more than sign-up rates. Customers may be in a browsing/purchasing mindset on weekends, not an account-management/cancellation mindset. Consider timing renewal reminder emails or nudges to arrive on weekends rather than early-week.
- Vitamins & Supplements stores see a wildly high Monday spike: 40% of all new subscriptions start on Mondays.
- Clothing & Fashion stores see peak cancellations (22%) on Saturdays, opposite to every other industry average.
- Food & Beverage and Cosmetics both peak for new subscriptions on Sunday (18% and 17% respectively): perhaps driven by "fresh start" consumer psychology.
- France is the only major market where Friday is the peak cancellation day (20%), significantly higher than the global Friday average (14%).
24. Globalization
WooCommerce has always been flexible enough to sell across borders, and in 2025 more merchants are actually doing it. This section explores how many countries and currencies stores sell in, the AOV premium cross-border shoppers bring, and the relationship between delivery distance and order value.
25. Country and currency insights
The median store sells to 3 countries, but the average is 13.5, a huge gap revealing a split market: the typical Woo store is overwhelmingly domestic, while a minority of stores serve a global base. Stores use an average of 3.2 currencies, up 14% from 2.8 in 2023, while countries sold to barely moved (+3.8%).
- Store currency: 85% of orders, $105 AOV (up 19% vs 2023)
- Non-store currency: 15% of orders, $125 AOV (up 14% vs 2023)
Cross-currency shoppers spend ~20% more per order than domestic buyers, perhaps less price-sensitive due to selection effects where only motivated, higher-intent buyers complete cross-border purchases.
26. Payment gateway AOV
Average order value by payment gateway:
- Bank Transfer, $281 (almost 3x the overall average; over 10x in some industries)
- Stripe, $119
- PayPal, $101
- WooPayments, $82 (lowest; likely the platform default for new stores)
Stripe has the largest AOV gap between starter stores ($45) and large stores ($132). PayPal has the smallest gap between sizes, with just a 57% increase from Starter ($67) to Large ($105).
27. Free vs paid shipping
Free Shipping has become the overwhelming default, 74% of orders include free shipping, up from 65% in 2023. Per-store medians:
- Median free-shipping AOV: $123
- Median paid-shipping AOV: $80
- Average shipping charge when charged: $9.27
Weighted averages tell a different story: platform-wide free-shipping AOV is $96, paid is $116. The democratization of free shipping pressures merchants to absorb more low-value orders, review whether your free-shipping threshold needs adjustment. Coffee industry stores show an extraordinary free-shipping AOV premium, $239 vs $129 for paid, jumping to 112% among large-tier coffee stores.
28. Delivery distances
Customers living 1,000 → 5,000 km away typically spend roughly twice as much as nearby customers. This "distance premium" is remarkably consistent across nearly all store sizes, most industries, and most countries. The 50–250km zone drives the largest share of all orders at 29%. AOV by distance bucket (change vs the overall $105 average):
- Under 50 km: $77 AOV (−27%), 11% of orders
- 50–250 km: $64 AOV (−40%), 29% of orders
- 250–500 km: $81 AOV (−24%), 17% of orders
- 500–1,000 km: $128 AOV (+20%), 11% of orders
- 1,000–2,500 km: $167 AOV (+57%), 16% of orders
- 2,500–5,000 km: $167 AOV (+57%), 10% of orders
- 5,000–10,000 km: $164 AOV (+55%), 3.3% of orders
- Over 10,000 km: $96 AOV (−9.6%), 2.8% of orders
29. How Metorik can help
Metorik was built 10 years ago as a reporting solution for WooCommerce and has since helped over 10,000 eCommerce stores. Core capabilities:
- Analytics & Reports, hundreds of reports and KPIs
- Automated Email Sales Digests, daily/weekly/monthly snapshots to email or Slack
- Customer Cohorts, hyper-segmentation to validate demographics and measure acquisition
- Subscription Reporting, MRR, churn, LTV, cohorts
- Data Exporting, CSV, email, scheduled, without load on your site
- Cost & Profit Reports, true profit on every order, product, and customer
- Superpower Segmenting, combine any properties to build audiences
- Abandoned Cart Tracking & Email, personalized cohort-driven recovery
- Email Flows & Newsletters, automation built for eCommerce
- Products Reporting, sales, profit, and inventory across multiple stores
30. Case study: Business Bloomer
Business Bloomer, founded by Rodolfo Melogli, is an educational platform that helps developers, freelancers, store owners, and agencies master WooCommerce through tutorials, courses, and live masterclasses. As the audience and product range grew (plugins, memberships, the Business Bloomer Club), the limitations of standard analytics became obvious.
Metorik surfaced revenue, retention, product performance, refunds, stock, and marketing sources, letting Rodolfo track his "productized" revenue mix and keep his refund rate below 1%. The real turning point was Metorik Engage, which became the engine behind WooWeekly (Rodolfo's flagship newsletter to 20,000+ subscribers) and now powers automations from abandoned-cart recovery to onboarding.
31. Case study: Verpakgigant
Verpakgigant is a Dutch packaging supplier that grew from a garage startup into a trusted partner for eCommerce businesses, logistics companies, and fulfillment centers. Founded by three friends to modernize an outdated, opaque industry, Verpakgigant built on WooCommerce but struggled to understand why some customers weren't returning and why so many carts were being abandoned.
Metorik enabled audience segmentation, identification of customers who hadn't reordered, more targeted follow-ups, and detailed insights into traffic, orders, cohorts, and cart behavior, reducing cart abandonment, improving retention, and freeing the team to focus on sustainable, customer-centric packaging.
32. Case study: Scratch Pet Food
Co-founders Mike Halligan and Doug Spiegelhauer took on Australia's $3 billion unregulated pet food industry by offering a healthy, affordable, transparent, 100% Australian-made subscription box. Over 6 years they've used Metorik to help grow their store.
WooCommerce Subscriptions lets them customize and remove friction, "friction equals churn, and churn equals less dollars." Metorik Engage automates tailored emails for each renewal (first renewal onboarding, second renewal lighter touch), and Metorik reporting lets the team dive deep into what they need to know.
33. Case study: Beaver Builder
Beaver Builder is a front-end page builder for WordPress used on over 1,000,000 sites. Over 7 years, they've used Metorik to grow their subscription-based store. Prior to Metorik, they exported all orders via a CSV-export plugin and sorted in Excel to see active subscriptions, manual and miserable.
With Metorik, pulling customer lists and filtering by product and order status enabled targeted reactivation campaigns. One email blast offering a coupon to lapsed renewers paid off Metorik's annual fee. Metorik also surfaces "whale" customers, their highest-package subscribers and multi-year renewers.
34. Closing
Ready to find the insights hiding in your store? Visit metorik.com.