The Product Reports you’ve always wanted.
Metorik delivers crystal-clear reports on your product sales, profit, and inventory – answering your most critical questions in seconds.
- Product, Category and Vendor-Level Profitability
- Inventory Forecasting
- Sync COGS from Shopify & WooCommerce

Powering Customer Segment insights for the world's best brands:
What's the real profit on that best-seller?
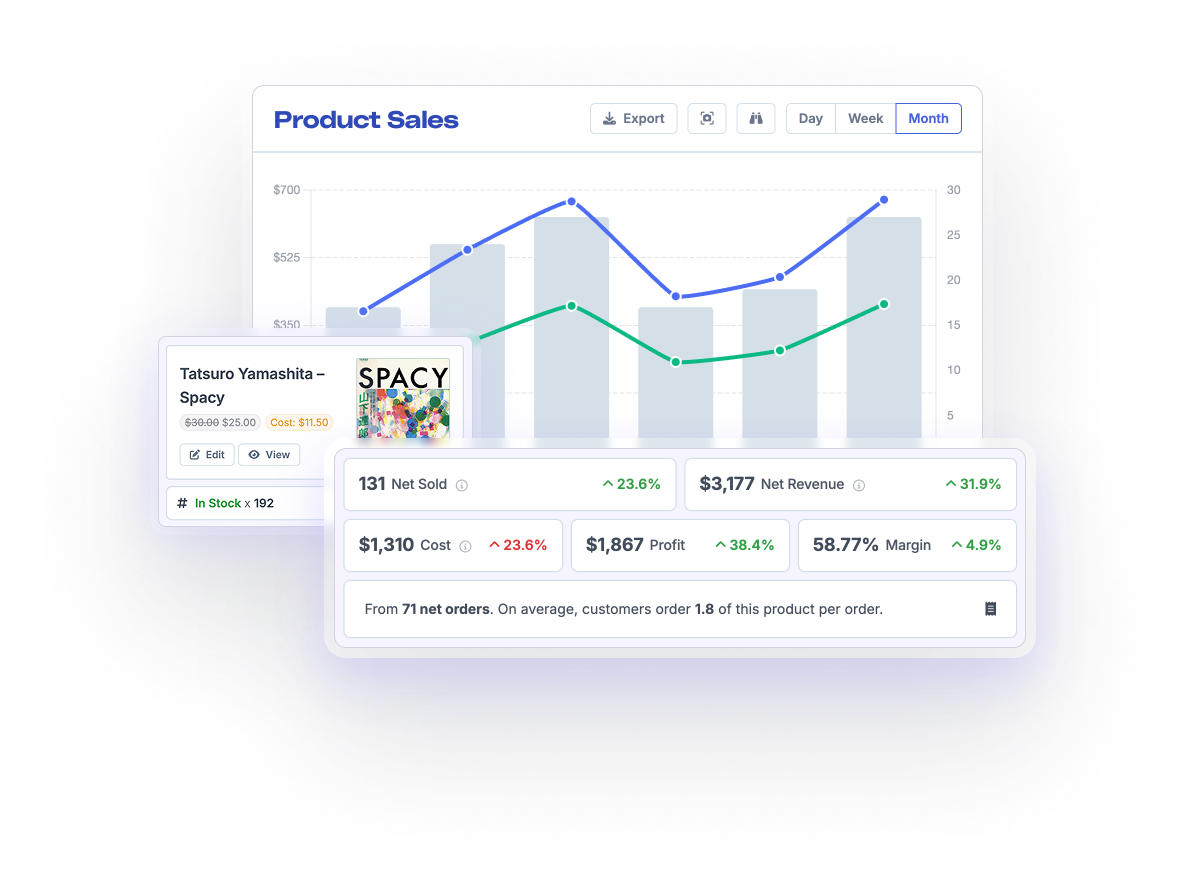
A sale is easy to see; accurate profitability is much harder. Metorik connects directly to your store and syncs your Cost of Goods Sold (COGS) for products and variations, letting you see your true profit and margins on every product, variant, and order — past or present.
Our "Frequently Bought Together" report reveals powerful bundling and upsell opportunities. Segment the report by customer or order data to identify market-specific trends.
The Customer Retention Cohort report shows you which products customers first purchased, that create the most loyal, high-LTV customers.
Instantly identify your most (and least) profitable products. Surface your profit-driving products, and reconsider stocking those costly laggards.
Metorik's segmenting, your new superpower.
Go beyond out-of-the-box product reports by applying any combination of hundreds of filters for customer behaviour, marketing attribution, and order details. This is where you find the growth levers no one else sees.
See the full story; match customer segments to products
Filter product sales by a customer's location, LTV, first order date, or even custom field data you’ve added.
Connect your marketing spend → to product sales
See exactly which products are being bought by customers from your Facebook Ads, Google campaigns, or influencer coupon codes.
Organize your products in any number of ways
Use our Product Groups feature to manually create custom collections of individual products or variations, for internal analysis.

⭐⭐⭐⭐⭐
As we sell multiple products, we often have questions that we need to answer.
For example, how many customers do we have in the UK or what have UK sales looked like over the last 6 months? The segmenting system really helps us answer these types of questions quickly and efficiently.
— Brian Zarlengan
General Manager, Output 🇺🇸

Never have to say “out of stock” again.
Stop letting stockouts drain your revenue and frustrate your customers. Metorik’s inventory tools give you the foresight to stay ahead of demand and optimize your cash flow.
- Forecast your inventory needs. Our system analyzes your past sales velocity to accurately project when you’ll run out of stock.
- Liquidate slow-moving stock. Easily identify which products are tying up cash so you can put them on sale and reinvest in winners.
- Automate your operations. Get a list of low-stock products or sales-by-vendor reports sent directly to your team in Slack or via email.
Join thousands of other stores benefiting from a clear view of their profitability
Ready to get clarity on your products and inventory?
Just a few minutes to connect. No developer required.
💳 Metorik is Free for 30 days, no credit card required.
View performance by Product, Variation, Category, Collection, Vendor, Brand, Tag, or Group
Metorik’s product reporting gives you a complete view of your store’s performance – from single product sales to high-level vendor trends.
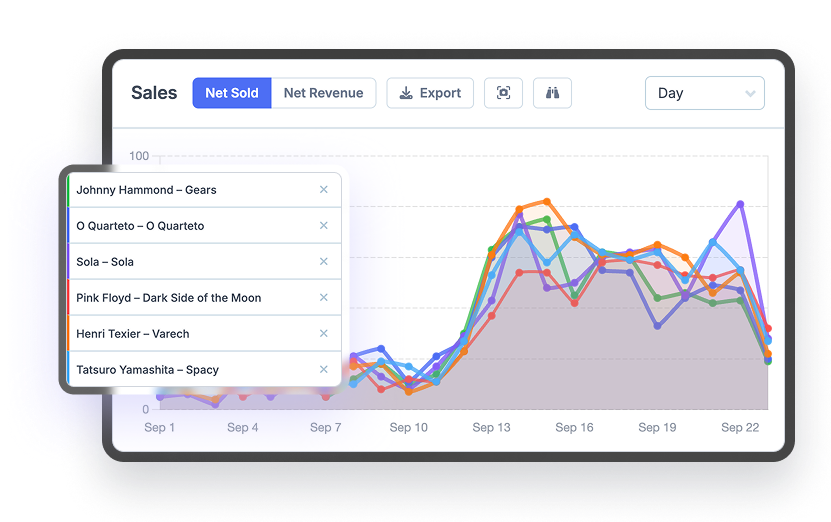
Analyze sales, inventory, costs, and profit at the product or variation level. Compare products side by side and slice your data however you like to answer your toughest product questions.
Sync your Shopify Collections or WooCommerce Categories to see detailed reports on sales and profitability over time. Compare categories side by side to uncover more granular insights.
View performance at the vendor or brand level to identify your best (and worst) profit and retention drivers.
Segment any report by tags, product attributes, or manual product groupings – all enabled by Metorik’s native Shopify and WooCommerce syncing and powerful reporting engine.
Powerful insights are just the start.
Product reporting in Metorik isn't the end; it's the start of a growth loop.
1. Report
Start with a powerful report to uncover a hidden opportunity. For example, find every customer who bought your coffee beans but not a coffee grinder.
2. Engage
With a few clicks, take that precise customer segment and send them a targeted email campaign with Engage, offering them the perfect grinder.
3. Measure
Track that campaign’s performance; opens, clicks, and revenue, right inside Metorik to see your exact return on investment and inform your next move.
Every insight is seamlessly connected to our engagement tools, allowing you to act on your data and measure the results instantly.

⭐⭐⭐⭐⭐
Integrating Metorik with our WooCommerce store and utilizing its data with our physical stores and inventory management system has been a game-changer for us.
It has not only streamlined our operations but has also allowed us to harness the power of data more efficiently. Metorik has become the cornerstone of our data-driven decision-making process , helping us make the most of our resources and time.
— Chris Cox
Marketing & eCommerce Manager, All Blacks 🇳🇿
Product Reports FAQs
Can't find what you're looking for below? Read our Help Docs
Does Metorik offer Shopify inventory reports?
Yes! Metorik provides powerful inventory reporting for Shopify, including stock levels, stock velocity, inventory cost and value. You’ll always know what’s selling, what’s sitting, and when to reorder—no spreadsheets required.
What’s included in your WooCommerce product reporting?
Metorik’s advanced WooCommerce product reports includes real-time sales, product performance by category or variation, customer segmentation, COGS, inventory insights, and more. Everything is deeply customizable and reports and segments load lightening-fast.
Can I analyze product categories and collections in Metorik?
Absolutely. Metorik allows you to run product category analysis and compare collections side-by-side. You can break down sales by category, collection, vendor/brand or tag, and filter them by customer type, country, marketing channel, and more.
How does Metorik handle WooCommerce inventory reports?
Metorik syncs your WooCommerce inventory in real-time, providing detailed inventory reports, including stock velocity and low-stock alerts. It helps you prevent stockouts, avoid over-ordering, and stay ahead of customer demand.
Can I get a Shopify sales report by collection in Metorik?
Yes. Metorik makes it easy to generate Shopify sales reports by collection. You can view total sales, top-performing products, and customer behavior within any collection, over any time range.
How can I find my top-selling products in Metorik?
With just a few clicks, you can view your top-selling products in Metorik. Metorik can even email you a daily or weekly report! Filter top products, categories or vendors/brands by any segment; first-time customers, campaign source, region, or device.
Can I combine inventory and sales data in Metorik reports?
Definitely. Metorik combines your sales and inventory data to show performance, profit margins, and stock levels together. This lets you make data-driven decisions like discontinuing slow-movers or doubling down on high-margin items.
Does Metorik support COGS and profit tracking per product?
Yes. Metorik syncs your product and variation cogs directly from Shopify & WooCommerce to calculate your profit margins per product, variation, collection, or vendor. You’ll get clear insights into margins, profitability, and how each product impacts your bottom line.
Still have questions?
Can't find the answer you're looking for? Chat to our friendly team.


Output: A modern take on music production
With big players in the audio software market like Apple and Ableton, you need to bring something special to the table to truly make an impact.